Glass Report
Last Updated: February 2026 Target Audience: QA, Operations Management
The Glass Report shows glass weight as a percentage of total pickup weight, sorted from highest to lowest. It highlights potential data quality issues when glass percentages are unusually high or e-waste weight is negative.
Navigation: Scott Recycling > Reporting & Analytics > Operations > Dynamic Glass Report
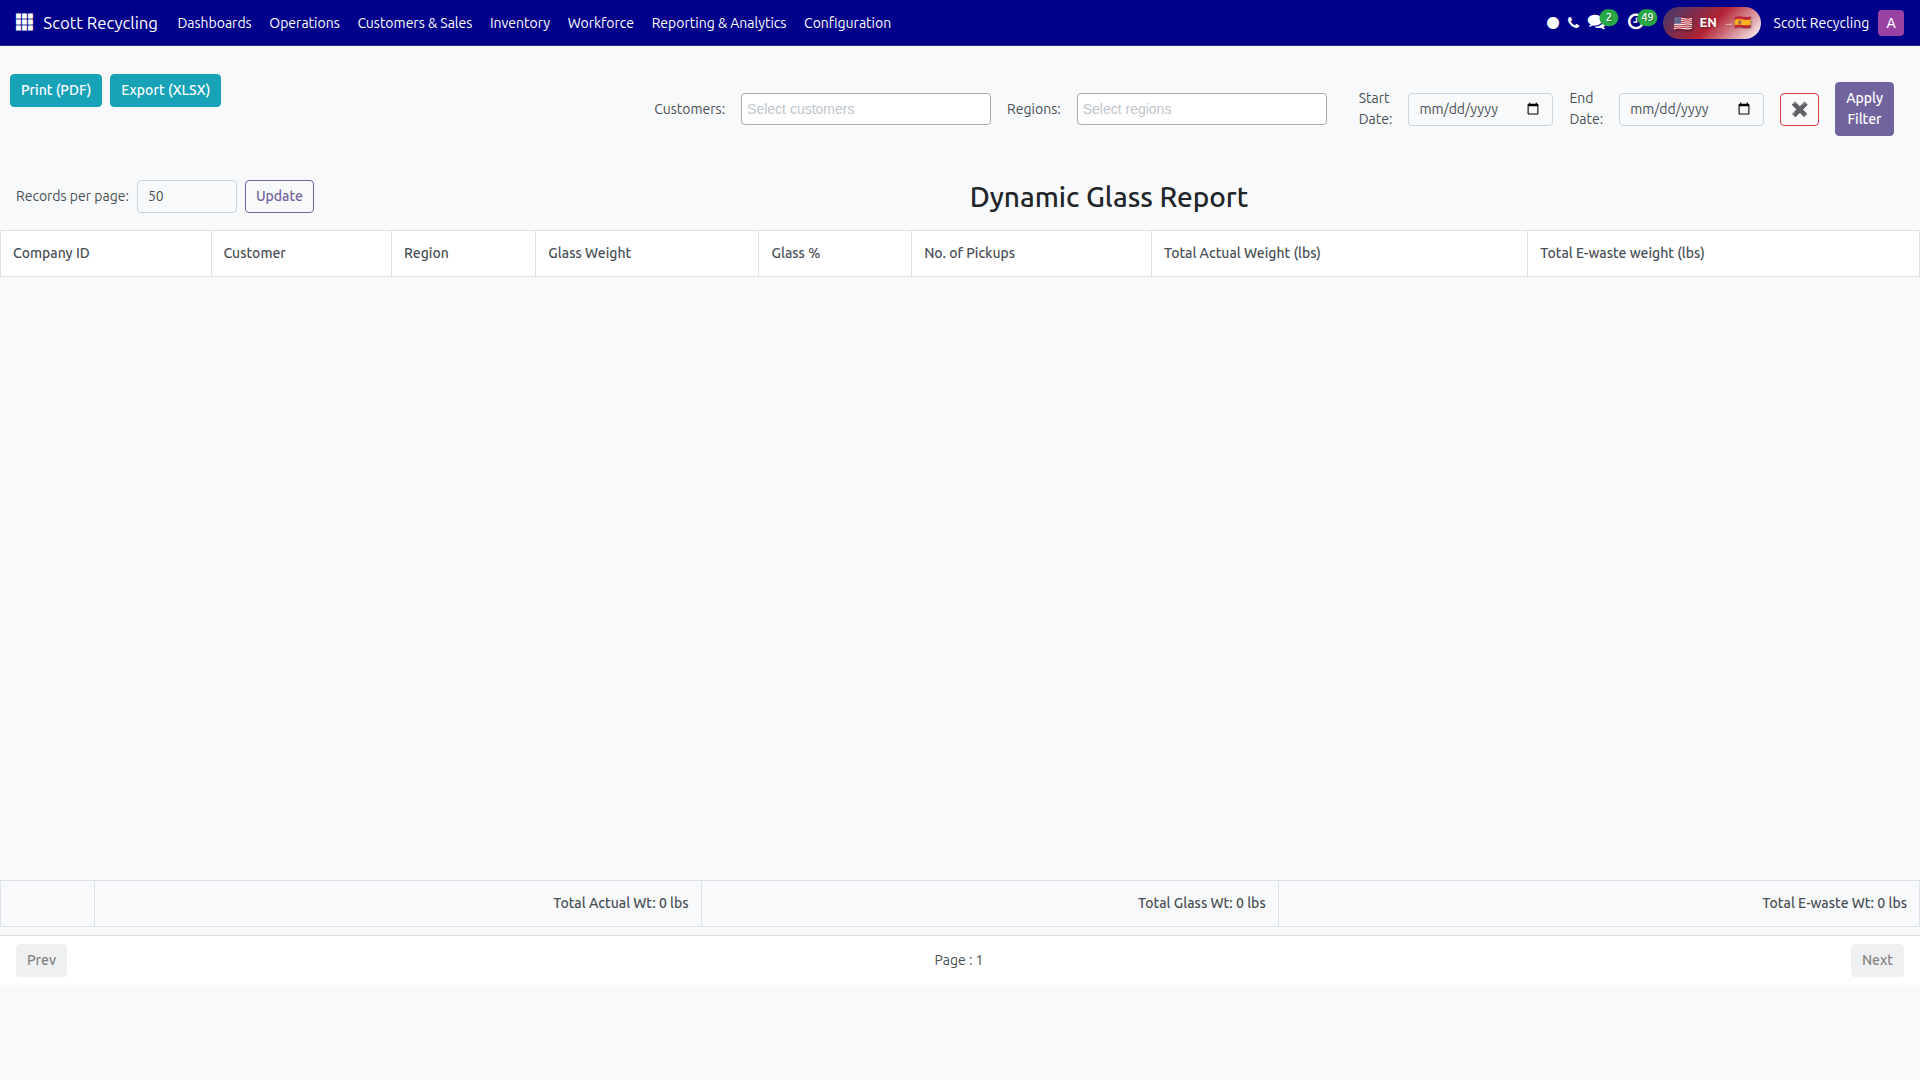
Filters
The Glass Report uses the same filter pattern as the Pickup Weight Report:
| Filter | Type | Description |
|---|---|---|
| Customers | Multi-select dropdown | Filter by one or more customers |
| Regions | Multi-select dropdown | Filter by one or more regions |
| Start Date | Date picker | Beginning of date range |
| End Date | Date picker | End of date range |
- Set your desired filters.
- Click Apply Filter.
- Click the X button to clear all filters.
Report Columns
| Column | Description |
|---|---|
| Pickup # | Pickup ID |
| Customer | Customer name |
| Region | Customer's region |
| PU Date | Pickup date |
| Actual Net Wt | Actual net weight (lbs) |
| Glass Wt | Glass weight (lbs) |
| Glass % | Glass as a percentage of actual weight |
| E-waste Wt | E-waste weight (lbs) |
Results are sorted by Glass % descending — pickups with the highest glass percentage appear first.
Data Quality Highlights
Rows are highlighted in orange when either of these conditions is true:
| Condition | Meaning |
|---|---|
| Glass > 90% | Unusually high glass content — may indicate a data entry error |
| E-waste < 0 | Negative e-waste weight — likely a calculation error |
Warning
Orange-highlighted rows should be reviewed. A pickup with >90% glass may have incorrect weight data or miscategorized items.
Export Options
| Button | Format | Details |
|---|---|---|
| Print (PDF) | Printable report with highlight indicators | |
| Export (XLSX) | Excel | Spreadsheet with all columns and glass percentage data |
Common Tasks
Identify data quality issues
- Open the Glass Report.
- Set a date range covering the period you want to review.
- Click Apply Filter.
- Look for orange-highlighted rows at the top of the list (high glass %).
- Investigate flagged pickups by clicking the Pickup # to open the pickup form.
Export glass data for analysis
- Apply filters for the desired date range and customers.
- Click Export (XLSX) to download.
- The spreadsheet includes all columns including glass percentage calculations.
Troubleshooting
| Issue | Solution |
|---|---|
| No data appears | Ensure the date range contains completed pickups with weight data. |
| Glass % shows 0% for all rows | Glass weight may not be recorded for these pickups. Check box content data. |
| Orange highlights everywhere | Multiple pickups may have data quality issues. Review weight entries for the flagged pickups. |