Daily Production Overview
Last Updated: February 2026 Target Audience: Shift Supervisors, System Admins
The Daily Production Overview shows today's warehouse activity broken down by two-hour time slots — boxes sorted, transfer activity by user and location, and processed inventory.
Navigation: Scott Recycling > Dashboards > Daily Overview
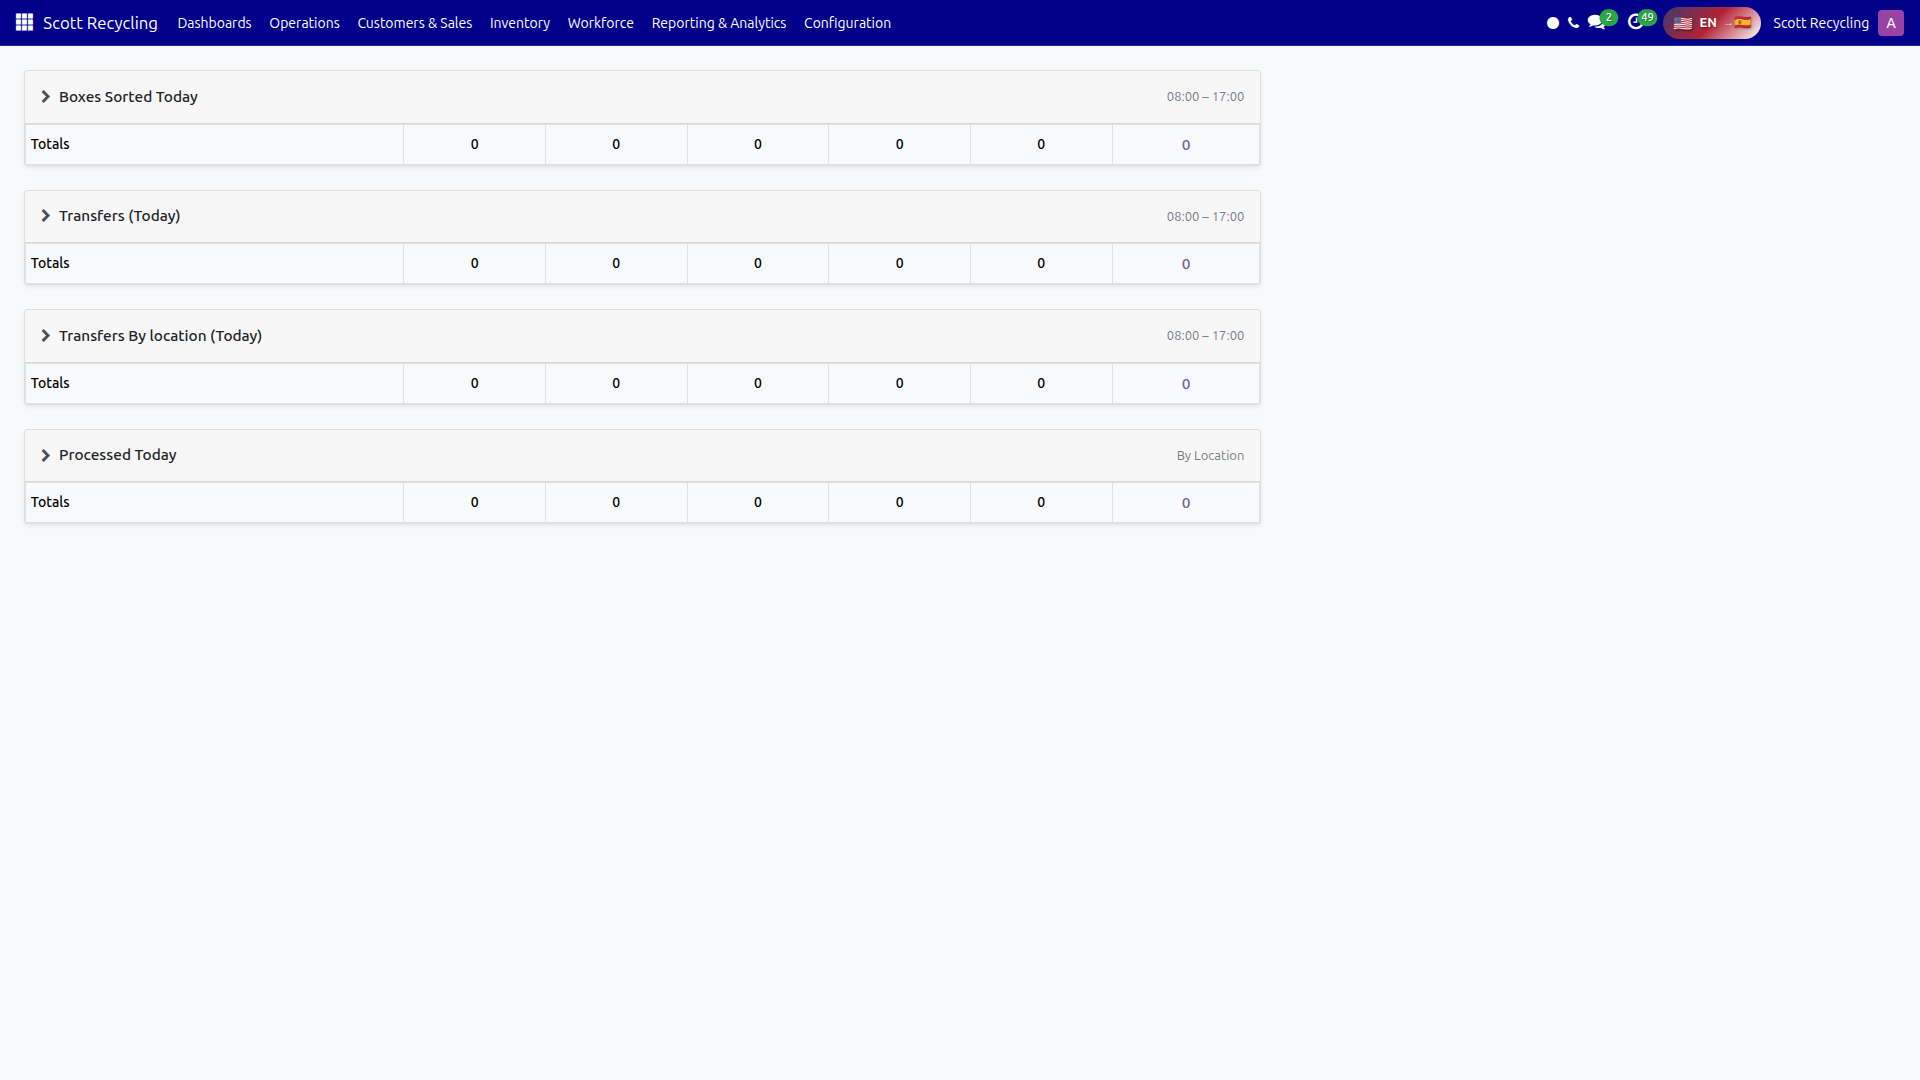
Layout
The dashboard has four collapsible cards. Click any card header to collapse or expand it. When collapsed, only the totals row is visible.
Time Slots
All four cards use the same time-slot columns (US/Eastern timezone):
| Slot | Hours |
|---|---|
| 08–10 | 8:00 AM – 10:00 AM |
| 10–12 | 10:00 AM – 12:00 PM |
| 12–14 | 12:00 PM – 2:00 PM |
| 14–16 | 2:00 PM – 4:00 PM |
| 16–17 | 4:00 PM – 5:00 PM |
Cards
1. Boxes Sorted
Shows the number of boxes each user sorted during each time slot.
| Column | Description |
|---|---|
| User | Employee name |
| 08–10 through 16–17 | Box count for each time slot |
| Total | Sum across all slots for that user |
Data source: Barcode scan logs grouped by user and scan time.
2. Transfer Activity (by User)
Shows transfer operations performed by each user.
| Column | Description |
|---|---|
| User | Employee name |
| 08–10 through 16–17 | Transfer count per slot |
| Total | Sum for that user |
3. Transfer Activity (by Location)
Shows transfer operations grouped by destination location instead of user.
| Column | Description |
|---|---|
| Location | Transfer location name |
| 08–10 through 16–17 | Transfer count per slot |
| Total | Sum for that location |
4. Processed Inventory
Shows inventory items processed at each location.
| Column | Description |
|---|---|
| Location | Processing location name |
| 08–10 through 16–17 | Items processed per slot |
| Total | Sum for that location |
Collapse / Expand
- Click the card header to toggle between expanded and collapsed views.
- Collapsed view shows only the totals row — useful for a quick summary.
- Expanded view shows the full breakdown by user or location.
Date Range
By default the dashboard shows today's data. Use the date range inputs at the top to view a different period. Activity is aggregated across all selected dates using the same time-slot columns.
Common Tasks
Quick morning production check
- Open the Daily Production Overview.
- Collapse all cards to see just the totals.
- Compare the totals against daily targets.
Identify slow periods
- Expand the Boxes Sorted card.
- Look for time slots with low counts across all users.
- Use this to adjust staffing for the next shift.
Track transfer throughput
- Expand Transfer Activity (by Location).
- Compare location totals to identify bottlenecks.
Troubleshooting
| Issue | Solution |
|---|---|
| All counts are 0 | Data is based on barcode scan logs. If scanning hasn't started yet, counts will be empty. |
| A user is missing | Only users with activity in the selected date range appear. |
| Time slots don't match wall clock | All times are in US/Eastern timezone. |