Using the Dashboard
Overview
Learn to navigate the SR Operations module, view WIP levels, check alerts, and monitor team performance.
Last Updated: February 2026 Duration: 20 minutes Audience: All Employees
Lesson 1: Module Navigation
Learning Objectives
- Navigate the SR Operations menu
- Access different sections efficiently
- Understand what each area shows
Main Menu Structure
SR Operations has four main menu items in the top navigation bar:
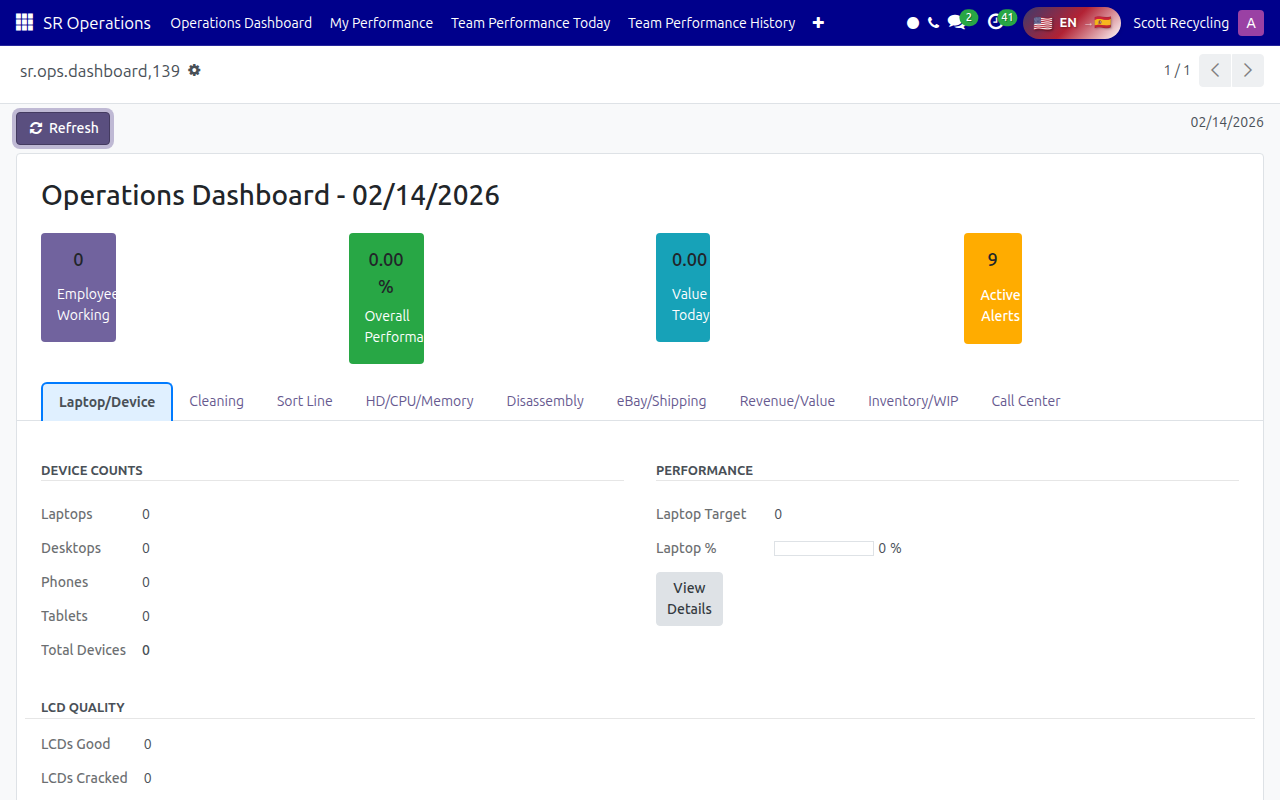
- Operations Dashboard - Today's performance summary with department tabs
- My Performance - Your individual KPI records
- Team Performance Today - All team members' performance for today
- Team Performance History - Historical performance data with filters
The full menu structure:
SR Operations
├── Operations Dashboard (Today's KPIs)
├── My Performance
├── Team Performance Today
├── Team Performance History
└── + (More menu)
    ├── Active Alerts
    ├── KPI Tracking
    │   ├── Daily KPIs
    │   └── KPI Templates (managers only)
    ├── WIP and Alerts
    │   ├── WIP Snapshots
    │   ├── All Alerts
    │   └── Alert Rules (managers only)
    ├── Training
    │   ├── My Training
    │   └── Training Modules (supervisors only)
    └── Configuration (managers only)
        ├── Employees
        └── SMS Log
Lesson 2: The Dashboard
Accessing the Dashboard
Navigation: Click SR Operations in the app menu, then click Operations Dashboard in the top bar.
The dashboard shows today's date, summary cards at the top, and department tabs below:
The summary cards at the top give you an instant overview:
- Employees Working - How many people are active today
- Overall Performance % - Team-wide performance against targets
- Value Today - Total value processed
- Active Alerts - Number of unresolved alerts (click to view them)
Department Tabs
Click any tab to see metrics for that area. For example, the Inventory/WIP tab shows current queue levels:
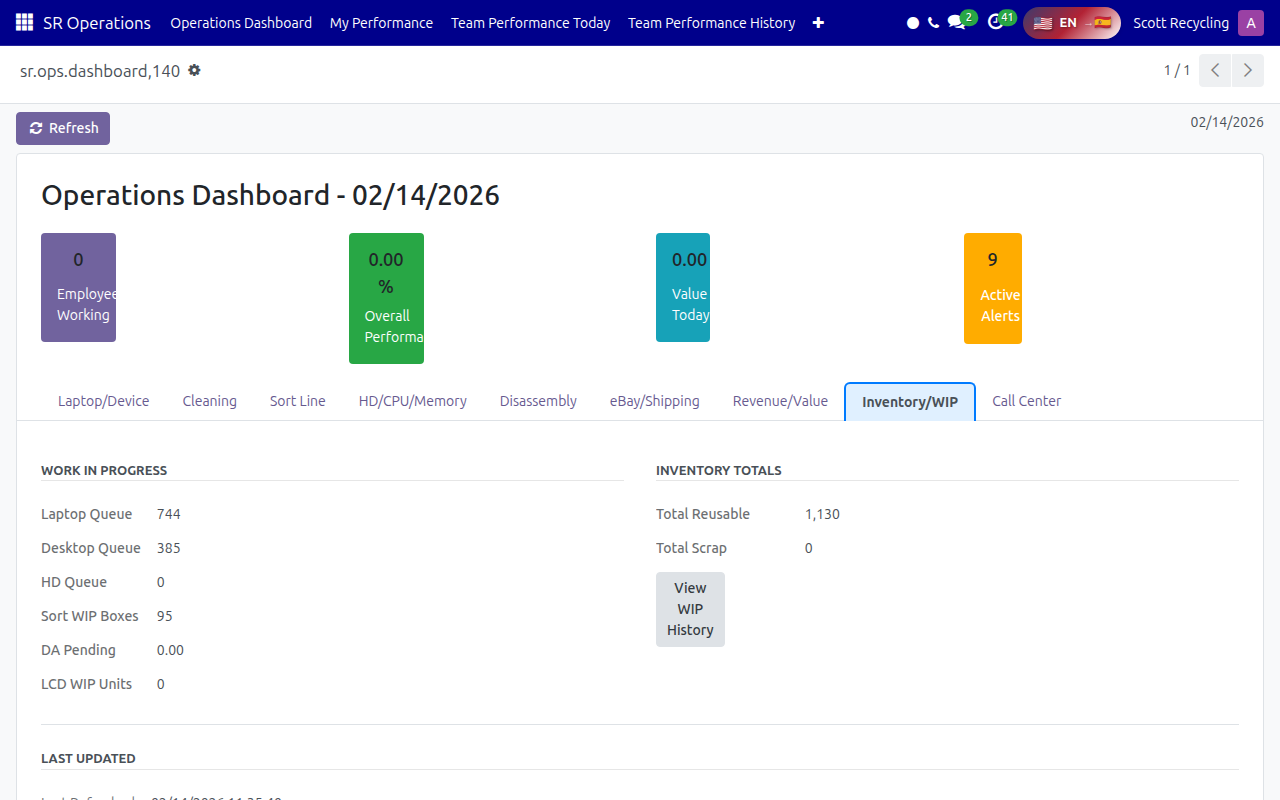
Available tabs: Laptop/Device, Cleaning, Sort Line, HD/CPU/Memory, Disassembly, eBay/Shipping, Revenue/Value, Inventory/WIP, Call Center.
Dashboard Columns
| Column | What It Shows |
|---|---|
| Date | Always today |
| Employee | Person's name |
| KPI Template | Their role type |
| Devices | Total devices processed |
| Laptops | Laptops specifically |
| Calls | Calls made (call center) |
| Performance % | Progress bar showing % of target |
| Status | Color-coded status badge |
Filtering the Dashboard
Quick Filters (top of list): - Today - Show only today's records (default) - This Week - Show all records this week - This Month - Show monthly data
Status Filters: - Below Target - Show only red status - On Track - Show only yellow status - Above Target - Show only green status
Department Filters: - Call Center - Only call center roles - Warehouse - Only warehouse roles
Grouping Data
Click Group By to organize data: - Employee - One row per person - Role - Grouped by KPI template - Status - Grouped by performance status - Week - Aggregated by week
Lesson 3: WIP Snapshots
What is WIP?
WIP = Work In Progress
WIP snapshots show the current backlog levels across departments. This helps identify bottlenecks before they become problems.
Accessing WIP
You can view WIP data two ways:
- Quick view: Click the Inventory/WIP tab on the Operations Dashboard
- Full history: Navigate to SR Operations → + → WIP and Alerts → WIP Snapshots
The left side shows Work In Progress queues (Laptop Queue, Desktop Queue, HD Queue, Sort WIP Boxes, DA Pending, LCD WIP Units). The right side shows Inventory Totals (Total Reusable and Total Scrap). Click View WIP History to see trends over time.
Understanding WIP Metrics
| Metric | What It Measures | Warning Level |
|---|---|---|
| DA Gaylords | Disassembly backlog | > 4 days = Warning |
| DA WIP Days | Days of DA work waiting | > 6 days = Critical |
| Laptop Queue | Laptops waiting to process | > 100 = Warning |
| Laptop WIP Days | Days of laptop work | Varies |
| HD Queue | Drives waiting | > 250 = Critical |
| HD WIP Days | Days of HD work | Varies |
| Today Routes | Scheduled routes today | Info |
| Today Stops | Total pickup stops | Info |
| Solid Days Next Week | Well-booked days | < 3 = Critical |
| Schedule Fill % | Route capacity used | < 60% = Warning |
WIP Days Calculation
Example: - 60 laptops in queue - Daily capacity: 20 laptops - WIP Days: 60 ÷ 20 = 3 days of work
Why WIP Matters
- High WIP = Falling behind, need more resources
- Low WIP = Running efficiently (or need more incoming)
- Balanced WIP = 1-2 days is ideal for most areas
Lesson 4: Alerts
Types of Alerts
| Severity | Icon | Meaning |
|---|---|---|
| Critical | 🔴 | Requires immediate attention |
| Warning | 🟡 | Needs attention soon |
| Info | 🔵 | For awareness only |
Viewing Alerts
Quick Access: SR Operations → Active Alerts (Shows only unacknowledged alerts)
All Alerts: SR Operations → WIP and Alerts → All Alerts
Alert Information
Each alert shows: - Timestamp - When the alert was created - Severity - Critical/Warning/Info - Area - Which department (DA, Laptops, Routes, etc.) - Title - Brief description - Message - Detailed information - Suggested Action - What to do about it
Acknowledging Alerts
When you've addressed an alert: 1. Open the alert record 2. Click Acknowledge 3. Optionally add resolution notes 4. Alert moves to "acknowledged" status
Lesson 5: Training Section
My Training
Navigation: SR Operations → Training → My Training
Shows your assigned training modules: - Module name - Assigned date - Due date - Progress percentage - Status (Not Started, In Progress, Completed)
Completing Training
- Click on an assigned training
- Work through each step
- Mark steps complete as you finish
- Some steps require supervisor sign-off
- Quiz steps require passing score
Training Status
| Status | Meaning |
|---|---|
| Not Started | Assigned but not begun |
| In Progress | Started, not complete |
| Completed | All steps finished |
| Overdue | Past due date, not complete |
Quick Reference
Daily Check Routine
Start of Day: 1. Check Dashboard for your status 2. Review Active Alerts for urgent issues 3. Check WIP Snapshots if you're a supervisor
End of Day: 1. Verify your KPI data looks correct 2. Acknowledge any alerts you've addressed 3. Note any issues for tomorrow
Keyboard Shortcuts
| Action | Keys |
|---|---|
| Search | Ctrl + K |
| New Record | Alt + C |
| Save | Ctrl + S |
| Refresh | F5 |
Common Actions
View your KPI details: 1. SR Operations → Dashboard 2. Click your row 3. Review all tabs
Check team status (supervisors): 1. SR Operations → Dashboard 2. Remove "Today" filter to see trends 3. Group by Employee
See what triggered an alert: 1. Open the alert 2. Click "View Snapshot" to see the WIP data
Questions? Contact your supervisor or refer to the detailed system documentation.