Calls Dashboard
Last Updated: February 2026 Target Audience: CSR Managers, Sales Leads
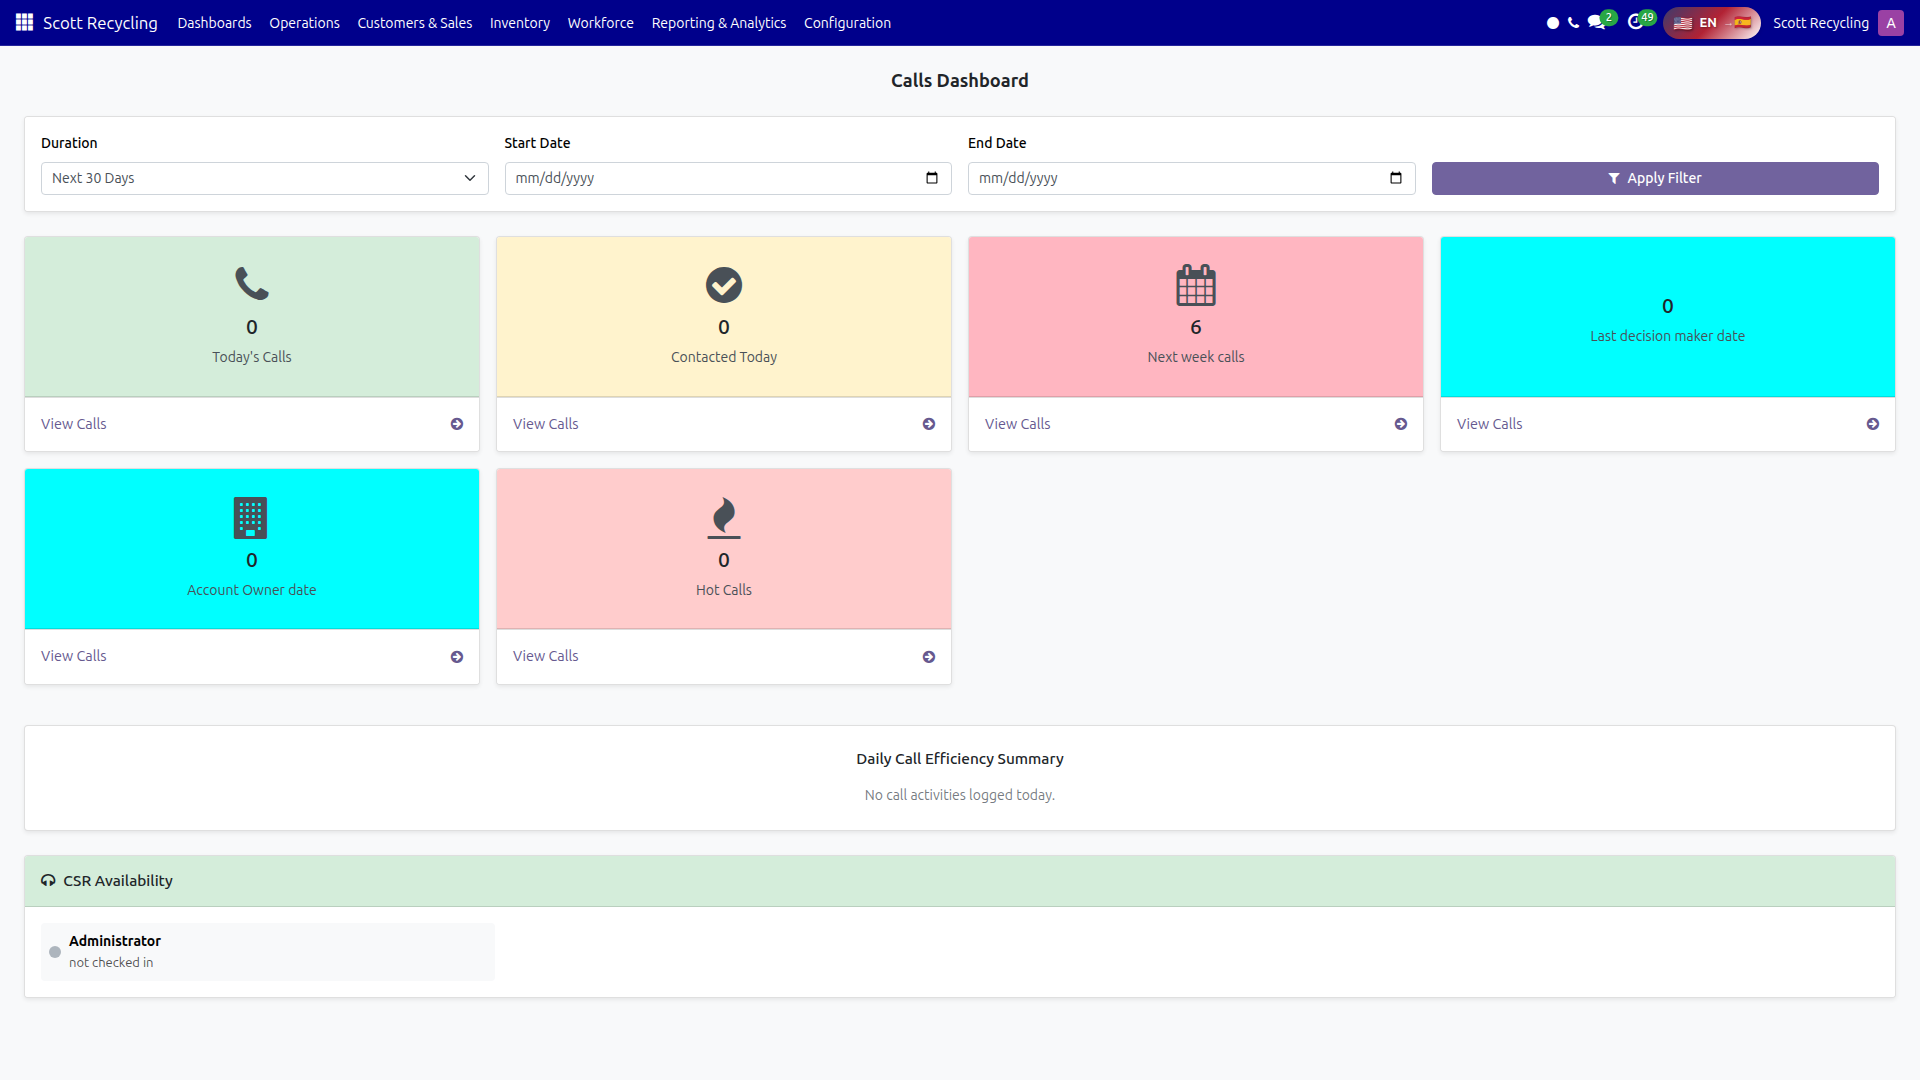
The Calls Dashboard gives a real-time view of today's call workload, team contact results, and CSR availability — all in one screen.
Navigation: Scott Recycling > Dashboards > Calls Dashboard
KPI Cards
Six metric cards are displayed across the top of the dashboard. Click any card to open the matching customer list.
| Card | Color | Metric | What It Shows | Click Action |
|---|---|---|---|---|
| Today's Calls | Green | Count | Customers with a call scheduled for today | Opens customer list filtered to today's calls |
| Contacted Today | Yellow | Count | Customers contacted (note logged) today | Opens customer list of today's contacts |
| Next Week Calls | Pink | Count | Customers with a call due next week | Opens customer list for next week |
| Last Decision Maker Date | Cyan | Count | Decision-maker contacts in the selected period | Opens decision-maker customer list |
| Account Owner Date | Cyan | Count | Account-owner contacts in the selected period | Opens account-owner customer list |
| Hot Calls | Red | Count | Hot-flagged customers with a call due today | Opens hot customer list |
Filters

The filter bar controls which time period the Decision Maker and Account Owner cards cover.
| Filter | Options | Default |
|---|---|---|
| Duration | Next 30 / 60 / 90 / 180 Days | 30 Days |
| Start Date | Custom date picker | — |
| End Date | Custom date picker | — |
- Select a Duration from the dropdown, or set a custom Start Date and End Date.
- Click Apply Filter.
- The dashboard reloads with updated counts for the decision-maker and account-owner cards.
Note
The Today's Calls, Contacted Today, Next Week Calls, and Hot Calls cards always reflect today's data regardless of the filter.
Call Results Chart

Below the KPI cards is a stacked bar chart showing calls by CSR and contact result type.
- X-axis: CSR names
- Y-axis: Number of calls
- Stacked segments: Each color represents a different contact result (e.g., Voicemail, Spoke to DM, Left Message)
- Legend: Displayed below the chart with result type labels
A summary line above the chart shows Total Calls and Unique Companies contacted.
Info
The chart uses data from the same date range as the filters. If no notes exist for the period, the chart area shows an empty state.
CSR Availability

The bottom section shows every sales team member's current availability.
| Indicator | Meaning |
|---|---|
| Green dot | Checked in — shows "in since HH:MM" |
| Gray dot | Not checked in |
This section updates when you click Apply Filter or reload the dashboard. It pulls attendance data for all users in the sales team group.
Common Tasks
Monitor today's call progress
- Open the Calls Dashboard.
- Compare Today's Calls (scheduled) vs. Contacted Today (completed).
- Click Contacted Today to see which customers have been reached.
Check who still needs to be called
- Click the Today's Calls card.
- The customer list opens showing everyone with a call due today.
- Customers already contacted will have today's date in their last-contact field.
Review call results by CSR
- Scroll down to the chart section.
- Each bar shows one CSR's call breakdown by result type.
- Hover over a bar segment to see the exact count.
Troubleshooting
| Issue | Solution |
|---|---|
| All cards show 0 | Verify the date filter is set correctly. Check that call notes are being logged with contact results. |
| Chart is empty | Notes must have a contact_result_id set. Notes without a result are not counted. |
| CSR Availability shows "No sales team members found" | The user's employees must be in the sales team group. Contact your admin. |
| A CSR shows as "not checked in" but is working | They may not have clocked in via the attendance kiosk. |